Miniprofiler - working out where view rendering time has gone
I'm having some slow loading times with some of my pages and am trying to work out what is causing them. The result from using Miniprofiler is:
The thing is, I can't work out where that duration has gone. "show trivial" shows a lot of 0.0 - 0.3ms tasks, and the sql queries shown have very small times too.
The problem I'm having is that the first time loading a page of each document type after Umbraco starts, it can take 10+ seconds for those request, whereas it would normally take <100ms.
Those partials are both pretty simple partials, with one or so database calls each. As previously mentioned, the database calls are taking up a tiny amount of time according to Miniprofiler, so the problem can't be there.
If I'm able to work out how to profile views to work out what's taking the time, it'd probably help me solve the issue. Maybe there's a general MVC tool out there? A Visual Studio extension?
Miniprofiler - working out where view rendering time has gone
I'm having some slow loading times with some of my pages and am trying to work out what is causing them. The result from using Miniprofiler is: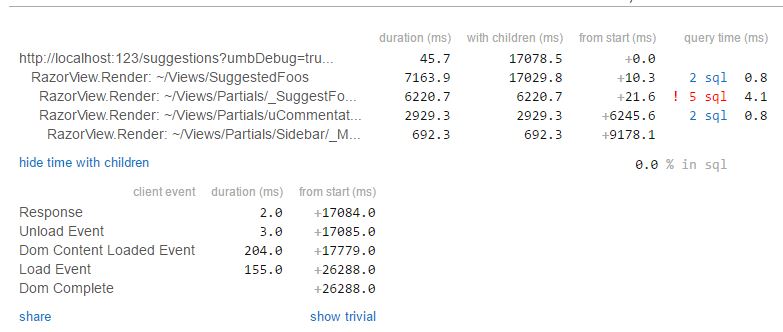
The thing is, I can't work out where that duration has gone. "show trivial" shows a lot of 0.0 - 0.3ms tasks, and the sql queries shown have very small times too.
What is in the _suggestFo* partial? And what code is rendered with the uCommentat* partial?
Are you using a package?
Hi Damiaan,
The problem I'm having is that the first time loading a page of each document type after Umbraco starts, it can take 10+ seconds for those request, whereas it would normally take <100ms.
Those partials are both pretty simple partials, with one or so database calls each. As previously mentioned, the database calls are taking up a tiny amount of time according to Miniprofiler, so the problem can't be there.
If I'm able to work out how to profile views to work out what's taking the time, it'd probably help me solve the issue. Maybe there's a general MVC tool out there? A Visual Studio extension?
is working on a reply...
This forum is in read-only mode while we transition to the new forum.
You can continue this topic on the new forum by tapping the "Continue discussion" link below.