I have a developed a custom section in Umbraco using Angular. All works find in development, where we have compilation debug="true" set in the web.config.
However, on the testing site, we have set debug="false" and suddenly parts of the custom section don't work. I know caching is more aggressive when debug is set to false, but I don't think this explains it as no files have changed between switching the web.config setting.
This suggests that something is wrong with my code, but I wondered if anyone else had come across this and had any pointers as to why this would be the case.
Hi James,
So when debug is set to false the Umbraco backoffice & App_Plugin with any custom JS or CSS will be loaded through a Client Dependancy Framework. So when you turn debug to true these assets do not go through this pipeline & thus is why it works for you there.
You are right when it comes to the assets being cached heavily, so check, check & check again that its not browser cache as it can be quite aggressive.
Next is to monitor all the requests in the browser development tools to see if there are any 404s or anything obvious & then onto some of the client dependancy calls to see if your JS is in there as expected.
If it's not you may need to bump the Client Dependancy Framework version.
So delete the cache files on disk at app_data/TEMP/clientdependancy & then goto config/clientDependancy.config and increase the version attribute by one, save & restart your website or App Pool.
Thanks for the detailed reply. That really helpful. I followed the steps suggested yet the issue persists.
I've performed some further investigation and can see the requests coming through the client dependency handler (DependencyHandler.axd) as expected. However, I have tree separate js files as part of the custom section. Each one makes a request to an endpoint, but in the network panel of chrome dev tools I can only see a call to one of these endpoints (see screenshot).
Could this be caching, or perhaps I need to understand a bit more about how the client dependency framework works? Any links to articles about the CDF would be appreciated :)
OK so this works fully when CDF is turned off then? If that is the case & only happens when CDF is turned on. I would ask for the developers help to see if he can assist you. You can grab him via twitter as @shazwazza or see if you can raise an issue on the GitHub repo for help.
But in the meantime I would look at the request of the DependancyHandler for getLevels HTTP Get to your API. By clicking on the link on the far end column you should see a minified version of the JS that CDF is serving up.
See if you can un-minify the JS by your preference of tool, to see if your HTTP GET or POSTs are in the JavaScript. If they are then it more likely points to a problem in the code, if they are not then maybe there was a problem concacting & minifying the JS.
Again this is all just a wild thought to help you to debug the problem. I know I had a similarish problem when I was including an already minfied external library for Analytics package I built. With the ChartJS already being minifed & going through CDF caused some unusual behaviour. So instead I included the non minified version of the JS library & my problems went away.
I finally got around to looking at this issue again. Many thanks for your replies, without which I would have never got to the bottom of this.
For anyone else interested, my original assertion was correct, it was my code that was at fault :0
The clue came when other custom sections built using Angular worked without any problems, with debug set to either true or false.
There was a timing issue with the Angular controller, which did not surface when debug was set to false. I assume the CDF loads scripts in a different order when debug is set to true. I wrapped the problematic section's controller in a self executing anonymous function (as all the other custom sections in this application were!), and the section now loads as all the others do. High five, me!
Hi James, I think I'm having the same problem would you mind sharing what you did to your code?
cause I made a custom Dashboard in umbraco and localy or when debug=true it works perfectly fine but after I deployed it when the debug=false the script stops working and I'm getting a DependencyHandler.axd error on the console.
after reading your solution this is what I did to my code
(function () {

   var controller = function($scope){
     //put codes here

   }

   angular.module("umbraco").controller("reports.reportsController", ['$scope', reportsController]);

})();
but it still not working and upon beautifying the script from DependencyHandler.axd? I can't seem to find my code. please help me.
Just for future reference I was able to solve my problem by doing the following
Delete cache files on disk every time I make some changes to my script
Update Client Dependency version
enclose my codes in an anonymous function (take a look at my previous post)
lastly I probably think that this is the actual solution to my problem is that I changed my javascript files from minified to
UNMINIFIED version in my package.manifest and everything worked
perfectly fine again even when the debug setting in web.config is
set to true.
Angular code fails when compilation debug="false"
Hi all,
I have a developed a custom section in Umbraco using Angular. All works find in development, where we have compilation debug="true" set in the web.config.
However, on the testing site, we have set debug="false" and suddenly parts of the custom section don't work. I know caching is more aggressive when debug is set to false, but I don't think this explains it as no files have changed between switching the web.config setting.
This suggests that something is wrong with my code, but I wondered if anyone else had come across this and had any pointers as to why this would be the case.
Hi James,
So when debug is set to false the Umbraco backoffice & App_Plugin with any custom JS or CSS will be loaded through a Client Dependancy Framework. So when you turn debug to true these assets do not go through this pipeline & thus is why it works for you there.
You are right when it comes to the assets being cached heavily, so check, check & check again that its not browser cache as it can be quite aggressive.
Next is to monitor all the requests in the browser development tools to see if there are any 404s or anything obvious & then onto some of the client dependancy calls to see if your JS is in there as expected.
If it's not you may need to bump the Client Dependancy Framework version.
So delete the cache files on disk at
app_data/TEMP/clientdependancy& then gotoconfig/clientDependancy.configand increase the version attribute by one, save & restart your website or App Pool.Hopefully this helps you James.
Cheers,
Warren
Hi Warren,
Thanks for the detailed reply. That really helpful. I followed the steps suggested yet the issue persists.
I've performed some further investigation and can see the requests coming through the client dependency handler (DependencyHandler.axd) as expected. However, I have tree separate js files as part of the custom section. Each one makes a request to an endpoint, but in the network panel of chrome dev tools I can only see a call to one of these endpoints (see screenshot).
Could this be caching, or perhaps I need to understand a bit more about how the client dependency framework works? Any links to articles about the CDF would be appreciated :)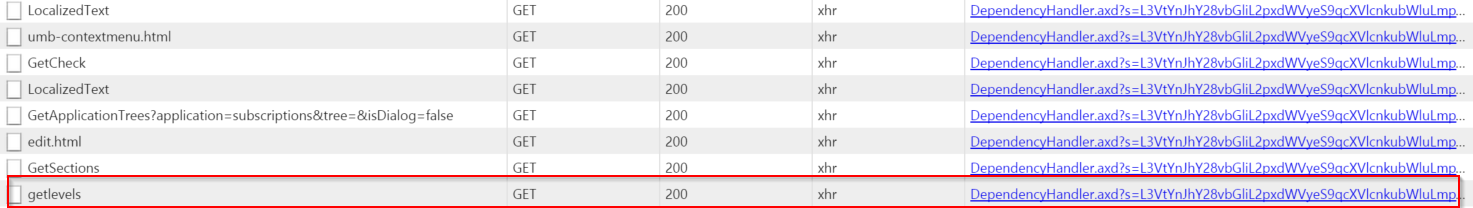
Apologies for the delay James.
OK so this works fully when CDF is turned off then? If that is the case & only happens when CDF is turned on. I would ask for the developers help to see if he can assist you. You can grab him via twitter as @shazwazza or see if you can raise an issue on the GitHub repo for help.
For docs & the repo it is here: https://github.com/Shazwazza/ClientDependency https://github.com/Shazwazza/ClientDependency/wiki
But in the meantime I would look at the request of the DependancyHandler for getLevels HTTP Get to your API. By clicking on the link on the far end column you should see a minified version of the JS that CDF is serving up.
See if you can un-minify the JS by your preference of tool, to see if your HTTP GET or POSTs are in the JavaScript. If they are then it more likely points to a problem in the code, if they are not then maybe there was a problem concacting & minifying the JS.
Again this is all just a wild thought to help you to debug the problem. I know I had a similarish problem when I was including an already minfied external library for Analytics package I built. With the ChartJS already being minifed & going through CDF caused some unusual behaviour. So instead I included the non minified version of the JS library & my problems went away.
I hope this helps.
Warren :)
Hi Warren,
I finally got around to looking at this issue again. Many thanks for your replies, without which I would have never got to the bottom of this.
For anyone else interested, my original assertion was correct, it was my code that was at fault :0
The clue came when other custom sections built using Angular worked without any problems, with debug set to either true or false.
There was a timing issue with the Angular controller, which did not surface when debug was set to false. I assume the CDF loads scripts in a different order when debug is set to true. I wrapped the problematic section's controller in a self executing anonymous function (as all the other custom sections in this application were!), and the section now loads as all the others do. High five, me!
Thanks again Warren for taking the time to reply.
Hi James, I think I'm having the same problem would you mind sharing what you did to your code?
cause I made a custom Dashboard in umbraco and localy or when debug=true it works perfectly fine but after I deployed it when the debug=false the script stops working and I'm getting a DependencyHandler.axd error on the console.
after reading your solution this is what I did to my code
but it still not working and upon beautifying the script from DependencyHandler.axd? I can't seem to find my code. please help me.
Thanks!
Just for future reference I was able to solve my problem by doing the following
is working on a reply...
This forum is in read-only mode while we transition to the new forum.
You can continue this topic on the new forum by tapping the "Continue discussion" link below.