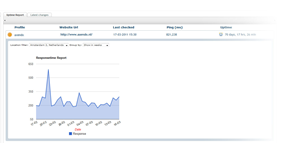
Axendo Uptime Report Dashboard
Axendo Uptime Report Dashboard
Credits: Stephen Maij - stephen.maij@axendo.nl
The Axendo Uptimereport dashboard enables you to see the up- and response- time for your websites. It also enables you to see the response time from other locations on the world.
This release comes with one statistics provider, but in the future we will also look on implementing other providers as well. For now, all you have to do is downloading and install this package, and create a free account on www.pingdom.com
The dashboard is using Google Chart, JQuery Template engine and it uses a Json based webservice to retrieve information from any other API.
To enable the dashboard you have to configure the Dashboard.config file from umbraco and add something like this:
<section alias="AxendoUptimeReport_Public">
<areas>
<area>content</area>
</areas>
<tab caption="Axendo Uptime Report">
<control>/AxendoUptimeReport/dashboard/Dashboard.ascx</control>
</tab>
</section>
<section alias="AxendoUptimeReport_Settings">
<areas>
<area>settings</area>
</areas>
<tab caption="Axendo Uptime Report Admin">
<control>/AxendoUptimeReport/dashboard/Admin.ascx</control>
</tab>
</section>
Feel free to try this package and give us some feedback!
- Package Files
- Documentation
- Archived Files

